Basics
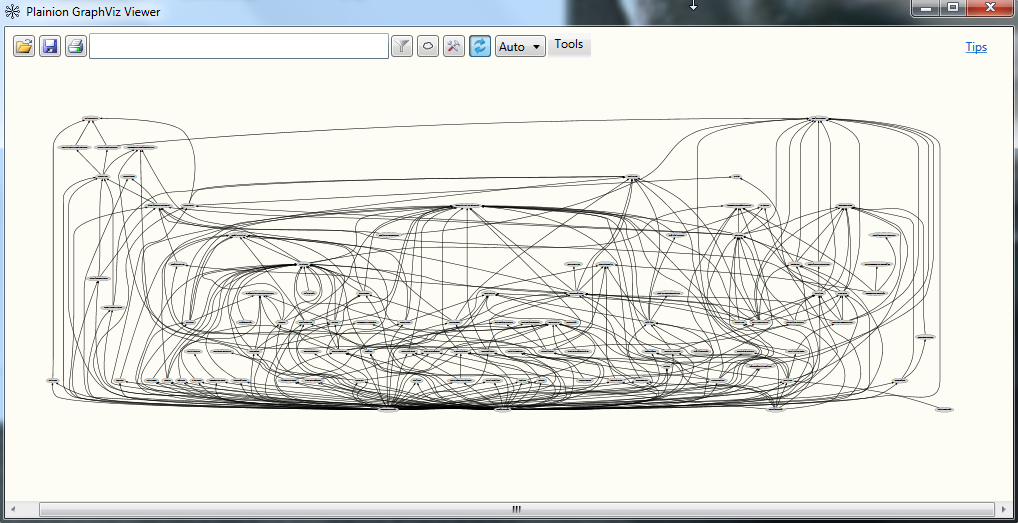
Each graph consists of nodes and edges. Optionally nodes an be grouped into (clusters)[Clusters].
The interaction with the graph is mostly mouse driven.
- Use LMB-Drag to pan the graph
- Use the mouse wheel or cursor up/down keys to zoom in and out at the point in the graph where the mouse pointer is pointing to
- Use RMB-Drag to draw a rectangle you want to zoom in
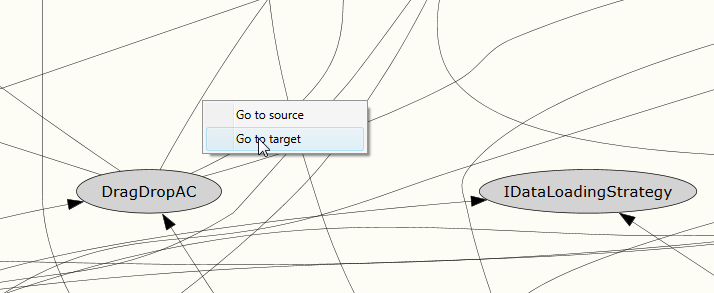
Use RMB-Click on an edge to jump to source or target node of that edge.
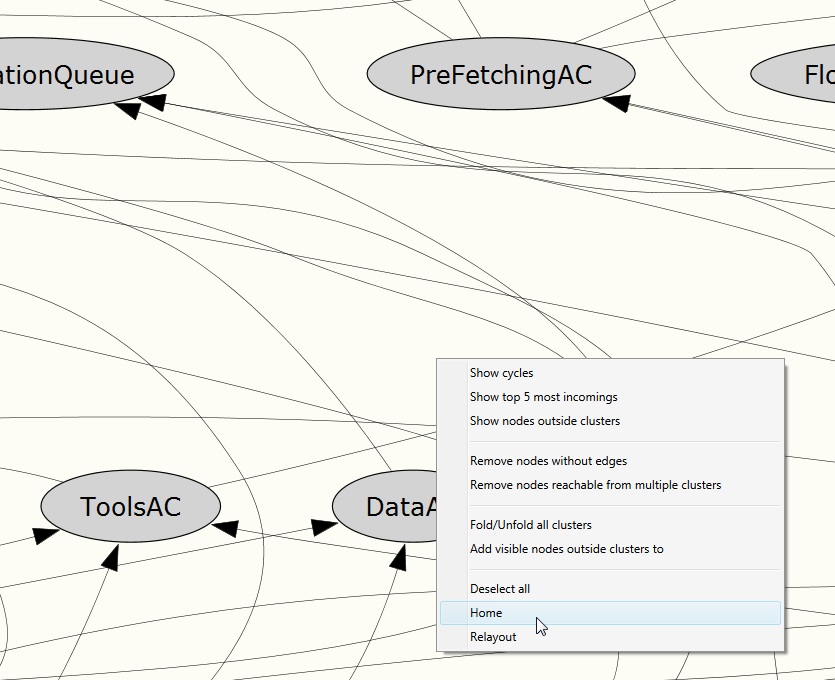
Use the RMB-Click on the canvas and the “Home” context menu to reset the zoom to the initial value.
Search
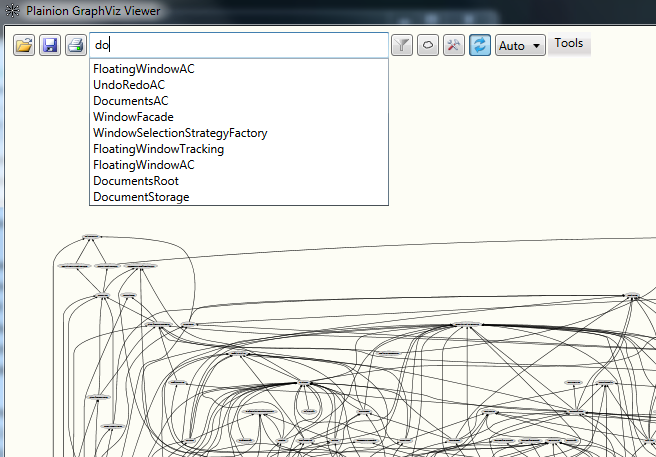
You can use the search box find nodes in a complex graph. It has a preview popup to support the search. You have to select the node you are interested in with ENTER to trigger the search.
Note: unfortionately the search is sometimes not exactly locating the found node in the center of the canvas, so you may have to slowly zoom out and check a bit left and right. This will be improved in future version.
Selection
You can you Ctrl-LMB-Click to select one or multple nodes and edges. This may help to keep the overview in a huge graph while manually navigating with zoom and pan.
Right-click the canvas and use “Select” > “All without sources” or “All without targets” to select visible nodes without visible incoming or outgoing neighbours, respectively. Existing selections are preserved.
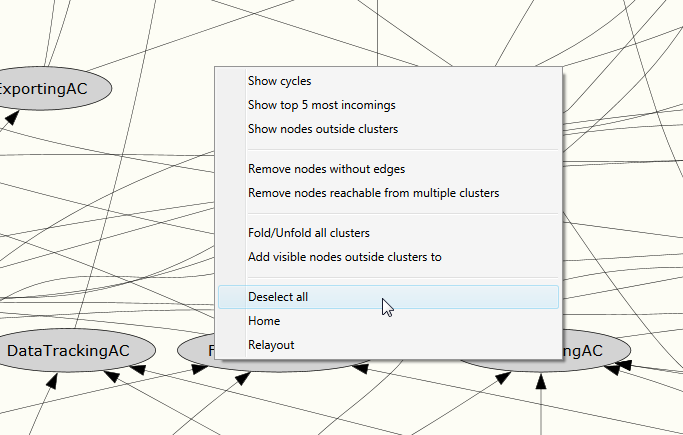
Use RMB-Click on the canvas and the “Deselect all” context menu to remove all selection from the graph.
Select nodes by pattern
Open the filter/selection dialog using the existing filter toolbar button and choose the Select tab. Enter a case-insensitive regular expression to match node captions, or enable Match on identifier to match node identifiers instead. The preview shows the visible nodes that match the pattern.
Enable Show selected nodes only at the bottom to limit the preview to selected matches. This option is off by default and affects only the preview: both actions still apply to all matching visible nodes.
Click Select matches or press Enter to add matching nodes to the existing selection. Click Deselect matches
to remove matching nodes. Other selected nodes and existing edge selections are preserved; connecting edges are
not selected automatically. Typing only updates the preview.
After either action, the pattern is cleared and the preview is refreshed.
An empty or invalid pattern disables both actions; use .* to match all visible nodes.
Selection respects the current filtering and folding. It does not reveal hidden nodes, unfold clusters, create filters, or change the graph layout.
Graph Layouts
Plainion.Graphviz supports various graph layout algorithms.
Tree
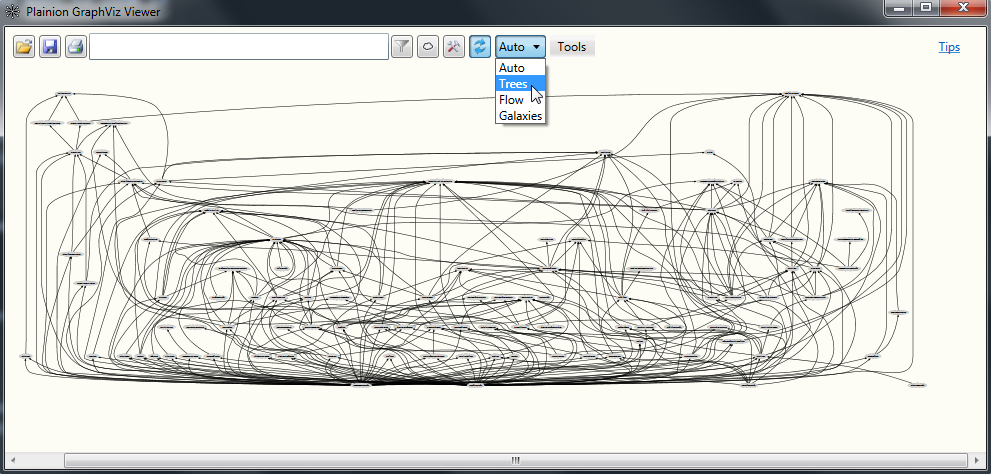
Most of the time you probably want to layout your graph in a kind of tree or hierachical structure because this gives usually the best overview about node dependencies.
Note: If the graph is too complex (too many edges) this layout algorithm may fail. You may even see a “Windows Error Reporint (WER)” dialog popping up. You can click it away - a fallback algorithm will be selected automatically.
Flow
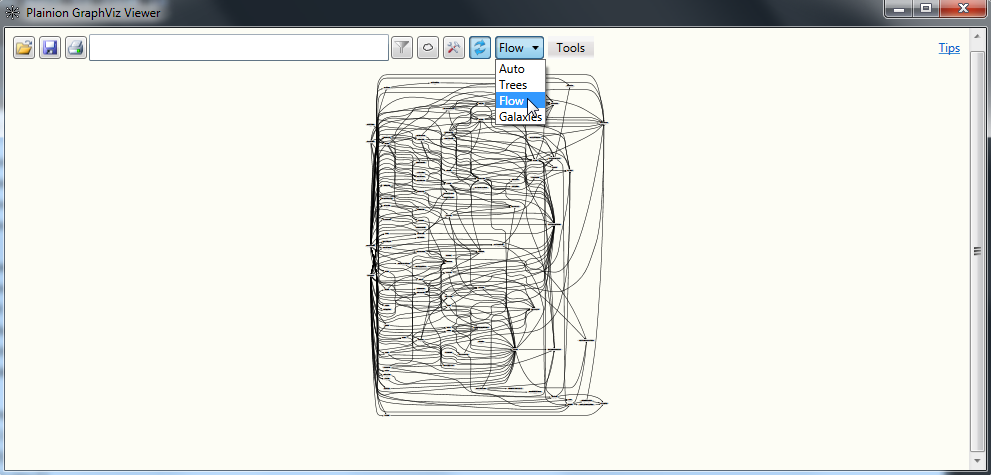
This algorithm is very similar to the “Tree” algorithm except that arrows are flowing from left to right.
Note: same limitation as with “Tree” algorithm
Galaxies
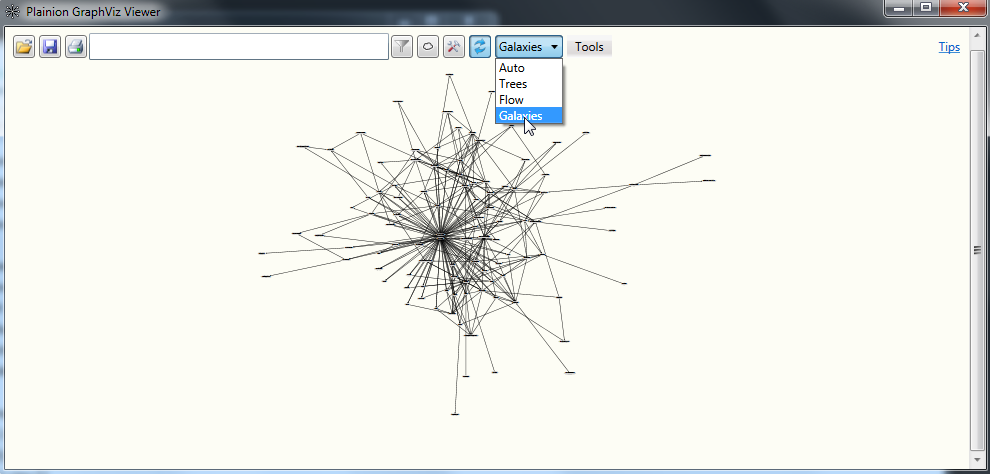
This algorithm organizes dependencies in a circular way. It is fast and can handle even extremely huge graphs.
This algorithm does not support clusters very well.